
Machine Downtime, Machine Utilisation and Downtime Systems
PlantRun OEE, machine downtime and manufacturing information systems give manufacturers the accurate live production performance data needed to maximise efficiency, output and profits.
Find out more at the PlantRun website.
Manufacturing efficiency can often be greatly improved by identifying the real reasons and true extent of production stoppages, constraints or bottlenecks caused by machine downtime. Based on our Prodigy software's Downtime Monitoring facility PlantRun automates downtime data acquisition, reporting and analysis for optimisation of uptime, output and return on investment.
Specifically designed for the automatic capture of machine performance data in realtime it minimises labour input and makes management information available instantly on demand.
Typical Downtime System Overview
A typical machine down time monitoring system is based around a single centrally located industrial PC with Microsoft Windows operating system. Specialised keypad terminals are situated adjacent to the machines to provide an interface between operators, machines and PC. Alternatively tablet or touch screen monitors can also be used.
Machine Downtime Tracking |
|
|
Existing computer networking or dedicated wiring is used to connect between operator interfaces and the PC. Any number of machines or production lines can be connected and monitored simultaneously with the status of each machine continuously recorded. The collected data is used to accurately calculate downtime, production rates, scrap count & reject rates, machine speeds as well as machine efficiency and OEE - Overall Equipment Effectiveness.
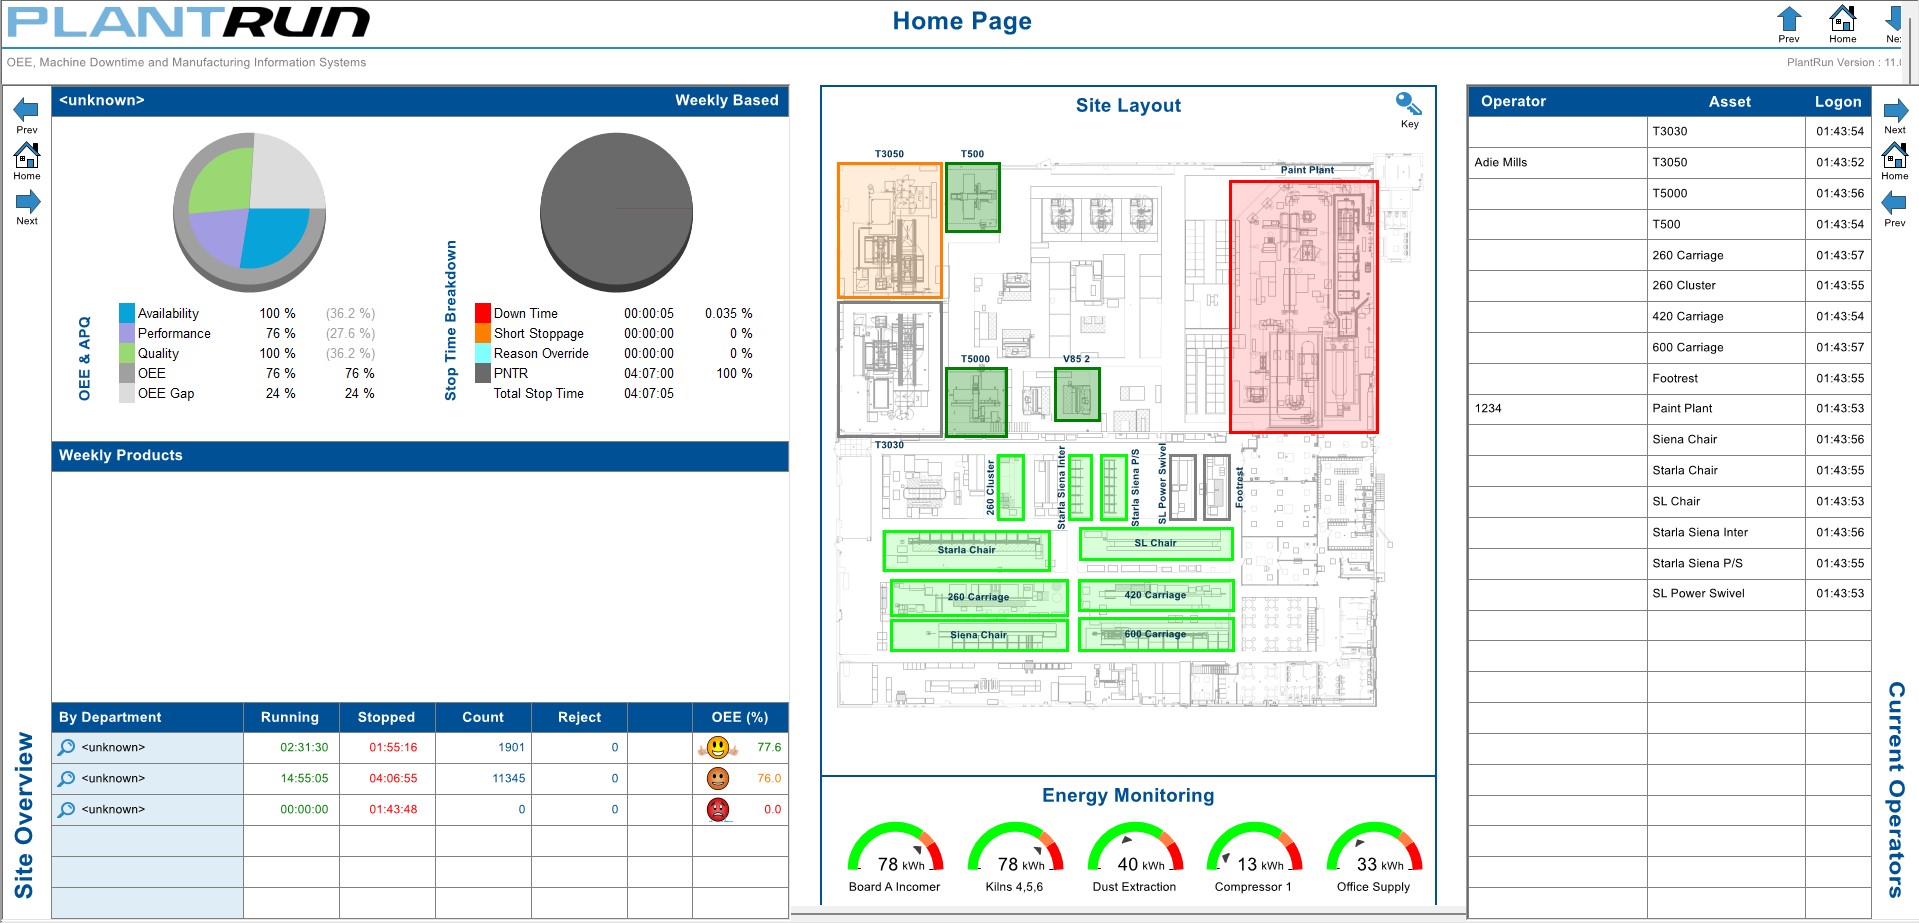
The system PC display acts as a 'shop floor overview' visualisation that gives the user an instant update on the production process at a glance. For instance, running machines are outlined in green, stopped machines in red, out of service machines in grey etc..
Clicking on any machine 'zooms in' to a full screen display of that machine showing more detailed information such as the current reason for stoppage, machine efficiency, estimated time to end of batch, number of products manufactured this shift/day etc.. Displays are fully customisable, interactive with animated graphics and can incorporate real-time and historic trend graphs. Any number of display screens or levels can be provided to represent even the most complex of operation.
 |
|
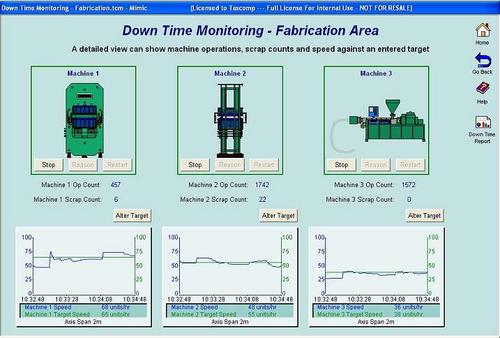
Plant overview example |
The screenshot below shows three machines which, on the live system, are animated when running. In this example each machine has production and scrap counters and a real-time trend showing actual versus target production rates.
 |
For fast response to problems any monitored parameter can have alarm limits set to trigger a siren, beacon, printer, email or send SMS text messages to mobile cellular 'phones. Alarms are versatile and can be used in various ways to reduce machine downtime such as alerting when stoppages occur, when bottlenecks slow production or when materials need replenishing.
Andon functionality allows staff to call for assistance without leaving the area. Typically used to call an engineer to a breakdown, it can also be used to call for a supervisor, parts, quality inspector, tool setter etc. The system records waiting, response and repair times and these can also be displayed on system PCs or large screen displays.
Display Node hardware allows connection of a monitor, TV or projector to display KPI's and custom messaging to inform and motivate your staff.
Distribute Information Enterprise Wide
System information can be viewed wherever needed, throughout the plant and offices or remotely over any distance. This allows access by head office, overseas division or even a production manager from his home PC. User passwords and privileges assure secure access with all user actions being recorded by the system.
All recorded data is stored in Microsoft Access or SQL compatible databases and can be shared with a wide range of standard PC applications. This allows exchange of information with production planning systems and enterprise information systems to feed back what has been achieved.
Relevant information is key to maximising efficiency and Prodigy provides powerful tools and reports to extract the information you need.
Asset View
Asset View allows you to analyse and manage the down time events of any machine. All events for a selected time span are displayed in a text table. Event type is displayed in coloured text with downtime highlighted in red. For fast analysis data can be sorted on time, duration, type and reason. Editing facilities allow downtime events to be assigned, split, combined or amended. Comments can also be added to events or amended.
'Quick Statistics' is a tool within Asset View that displays the main statistics for the machine or asset data being viewed. This includes totals and percentages for downtime plus top downtime reasons by duration, by number of events and by level - concise information at a glance.
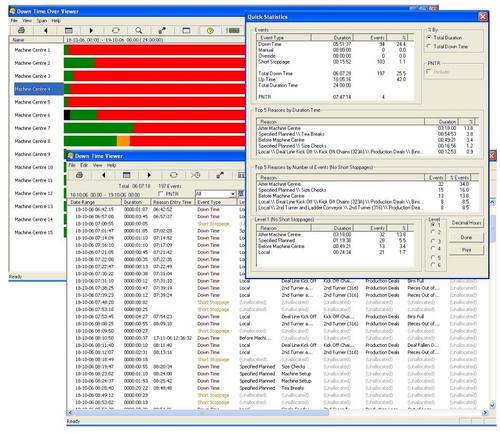 |
| Asset View, Group View and Quick Statistics |
Downtime reports can be run straight from Asset View or Quick Statisitcs at the click of a button. Pareto analysis options can generate reports in "Greatest Time" or "Greatest Count" order. Ranking downtime in this way focused attention on to those areas that will produce optimum returns. Data can be exported directly from Asset View to csv or Ms Excel format.
Group View
Group View lets you quickly compare machines, highlighting patterns and anomalies in performance that otherwise are difficult to identify. This is achieved by displaying the state of any number of machines as coloured time lines. The colour changes with the status of the machine, green for running, amber for short stoppage, red for long stoppage etc..
Left clicking on any event on a time line displays the details, including the reason, of the event in a pop up box. A sort option allows the time lines to display the accumulated time for each type of event as solid blocks of colour. This allows a powerful direct comparison machine against machine and at the click of a button across consecutive time periods.
Filtering on Product, Operator, Batch and Shift allows you to do detailed analysis against any of these parameters. Quick Statistics tool can be used in the same way as in Asset View with the option to view summary data of any selection of assets, assets grouped as departments or all assets.
Downtime and Production Reports
Flexible report options provide the management information you need, how and when you want it. Downtime or production reports across machines, shifts, production lines, products, operators, reject rates etc. are available instantly. Fully customisable, reports can combine text, graphics and trends and cover any time period, shift, day, month etc. They can be produced on demand or at preset times and can be sent to a printer, email, pdf, published to the internet or via SMS message to mobile cellular 'phones. Data can be exported for use in your exisiting report tools such as MS Excel or Power BI.
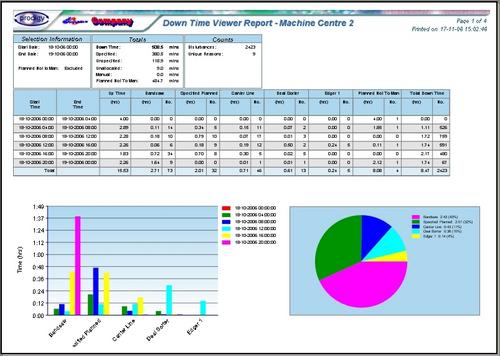 |
| Example Downtime Report |
Accurate Downtime Calculation
Machines will typically suffer short stoppages of just a few seconds when operating 'normally' and long stoppages of minutes or hours when major disturbances occur. Every machine stoppage is recorded as an individual event. This allows every downtime event to be analysed and offers a high level of detailed and specific information not always available in other downtime systems.
Each downtime event can be assigned a reason and also a comment. In practice a time threshold is set for each machine to differentiate between a short and long stoppage.
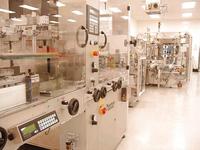 |
| Pharmaceutical Downtime Application |
When a machine has been stopped longer than the preset time a reason must be assigned to the event. A machine 'interlock' can be used to prevent the machine from being restarted until a downtime reason is entered. This ensures that the operator enters the reason for the stoppage at the time it occurs and not at the end of the shift when they may have forgotten or feel tempted to alter it. Interlock override allows for changeover, maintenance and setup periods. An interlock uses an output from the system, typically wired across the start circuit of a macine or asset.
Short stoppage time is often viewed as negligible but when it is recorded accurately can be surprisingly large and is frequently found to be a major factor in lost production. Reducing short duration stops not only increases efficiency but also eases the burden on operators resulting in improved man-machines ratio.
Downtime reasons are selected from scroll lists on the operator interface or keyed in as a short code. Where possible downtime reasons are also captured automatically from PLC's and associated control equipment.
Each machine has unlimited user defined downtime reasons stored and edited from the central PC. This makes it easy to manage downtime reasons with any changes made appearing instantly on the relevant shopfloor terminals. This allows great flexibility to continuously improve machine efficiency. PlantRun's ease of use means that you are not reliant upon the system suppliers whenever you want to make changes, saving both time and money.
Downtime reasons are multi-level allowing any upper level reason to have multiple sub options. Multiple reasons can be assigned to a stoppage if the reason for the downtime changes during the stoppage. Comments can be added to downtime events, either when the stoppage occurs or at a later time. These can provide specific information about a stoppage to aid fault identification, diagnosis and repair etc. As well as monitoring individual machines or processes, PlantRun can monitor linked production lines, handling the more complex requirements of inter-machine buffering, materials re-stocking and cascaded interlocks.
Machine Speed Optimisation
For any machine there will be an optimum running speed. Continuous monitoring allows you to closely manage machine or line running to determine optimum speed, which may vary, depending upon products or materials. PlantRun will notify if a machine is running below its target speed and a reason can then selected for the slow running. This event information can then be viewed, analysed and reported with the system tools just like downtime.
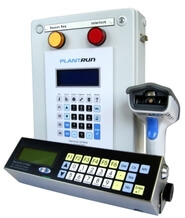 |
| Shopfloor Terminals and Barcode Reader |
Shopfloor Downtime Terminals
Shopfloor terminals feature multi-line alpha numeric LCD displays with customisable wipe clean overlays and user configurable function keys. As well as entering downtime reasons terminals can be used to input batch / order / operator / operator codes and view information such as current / target production rates reducing the need for operators to leave the machine area. A range of terminal hardware is available to suit any application as well as peripheral hardware including;
Barcode scanners and swipe cards - for data input and product tracking.
Large format shopfloor displays - to show actual and target production rates, informing and motivating staff to what must be done to achieve shift or daily targets.
Touchscreen & PC Operator Interfaces
PC and touchscreen and tablet hardware can be used as operator interfaces. Screen displays are fully customisable and are ideal for applications that require display of graphics, images or work instructions etc.
Improved Maintenance Scheduling
PlantRun provides additional facilities for improved maintenance efficiency. As the machine run / cycle times are continuously recorded the system can be set up to automatically alert when maintenance is due.
The system can also store information files for easy retrieval when they are needed. These could be emergency contact numbers, parts lists, schematic diagrams etc. in the form of text, image, audio or video. Having crucial information readily available can reduce stoppage time as well as being an aid for maintenance and training.
Fast Return On Investment
PlantRun Downtime and OEE Monitoring has been applied successfully to most types of manufacturing operation, discrete and linked machines, production lines, and automated test systems. With a system typically costing just a fraction of the value of the machines it monitors, implementation makes real financial sense with fast return on investment. Also, capital expenditure on new equipment can often be eliminated by increasing the utilisation of existing assets.
A Complete Service
We provide a complete and ongoing service that ensures smooth implementation with no disruption to your day to day operations. We offer training courses both for your key project personnel and operators plus efficient technical support when it is needed and optional maintenance contracts.
Get more information on PlantRun OEE and Machine downtime tracking systems at our dedicated web site - PlantRun
